What is AppDynamics?
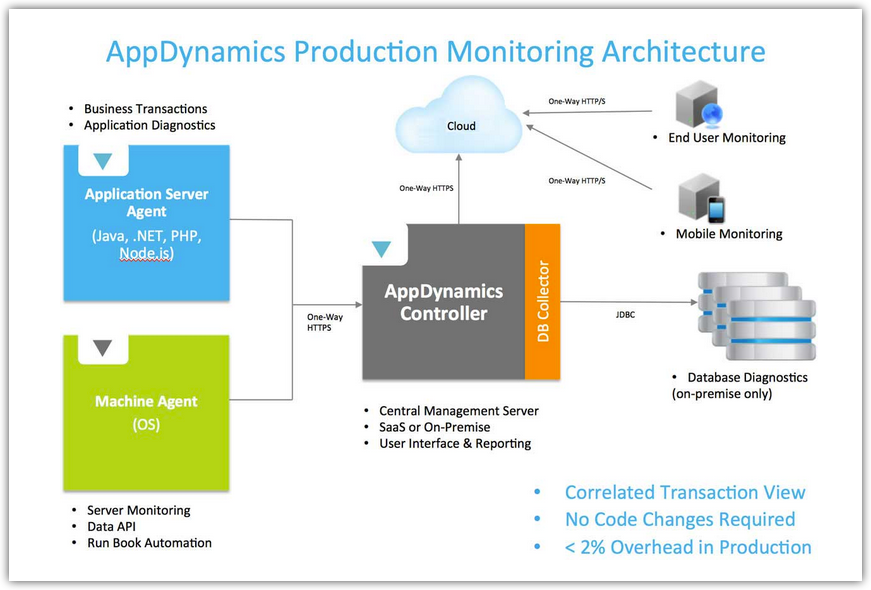
AppDynamics is a leading Application Performance Management (APM) product. It is a tool that monitors your Application Infrastructure and gives you code level visibility. It is supported for all major technologies (Java, .NET, PHP, Node.js, NOSQL etc) and can be installed either as on-premise or as SaaS (Software As a Service) solution.
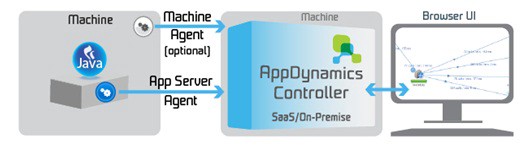
A piece of software called Agent is installed in the Application to be monitored. The Agent collects the performance metrics and sends them to a Server process called Controller. Controller processes the metrics and presents them via Web Browser. A monitoring analyst can configure Alerts and generate reports using the Web Interface.
The agent constantly monitors the application. Since it uses byte code instrumentation technology, Agent has hooks to every line of code. This is how AppDynamics is able to provide code level visibility. Agents are available for most of the popular technologies.
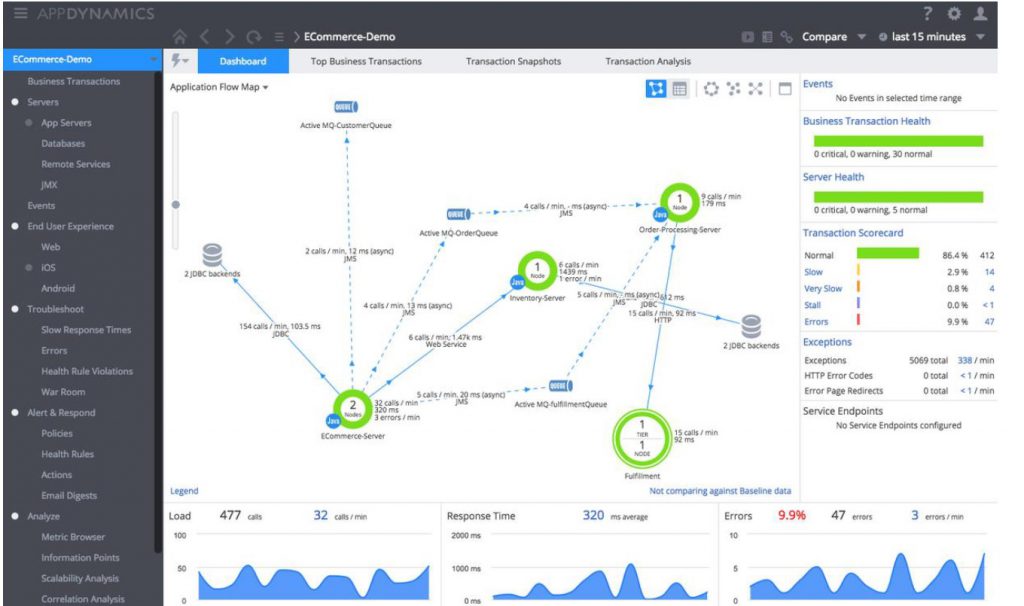
Most of the monitoring capability is ‘out of the box’, including and Alerts. Another neat ‘out of the box’ feature is the ‘Application Flow Mapping’. AppDynamics discovers various subsystems and backends and draws them beautifully on the browser. At times, you will be surprised to discover about backends that you never thought your application was talking to. In addition AppDynamics ‘learns’ application behavior and automatically sets baselines, and alerts when the deviation from baseline is not normal (anomaly).
AppDynamics employs the concept of ‘Business Transaction’ (BT). A BT represents a service provided by your application that is invoked by the user. All involved subsystems and backends for a given BT are tracked and reported by AppDynamics. BTs are automatically discovered but you can define your own BTs as well.
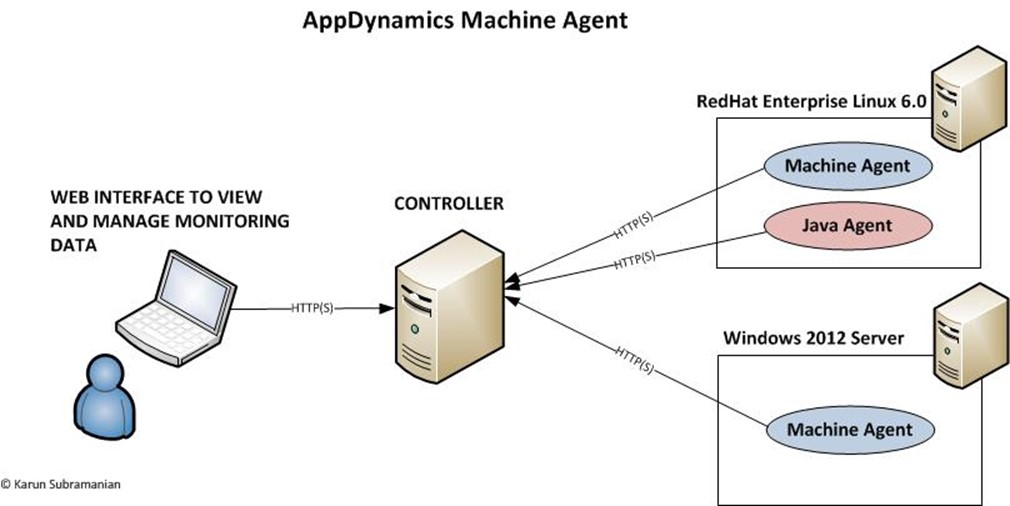
Using a special type of agent called Machine Agent’, AppDynamics can monitor hardware too. Basic resource utilization such as CPU,Memory,Disk usage are monitored. Machine agents are available for most OS (Windows, Linux, Solaris etc).
AppDyanmics lets you write your own extension using shell scripts or Java. It is a very powerful feature that enables you to monitor virtually anything. There are numerous extensions already developed by the community and available for download.
AppDynamics Architecture
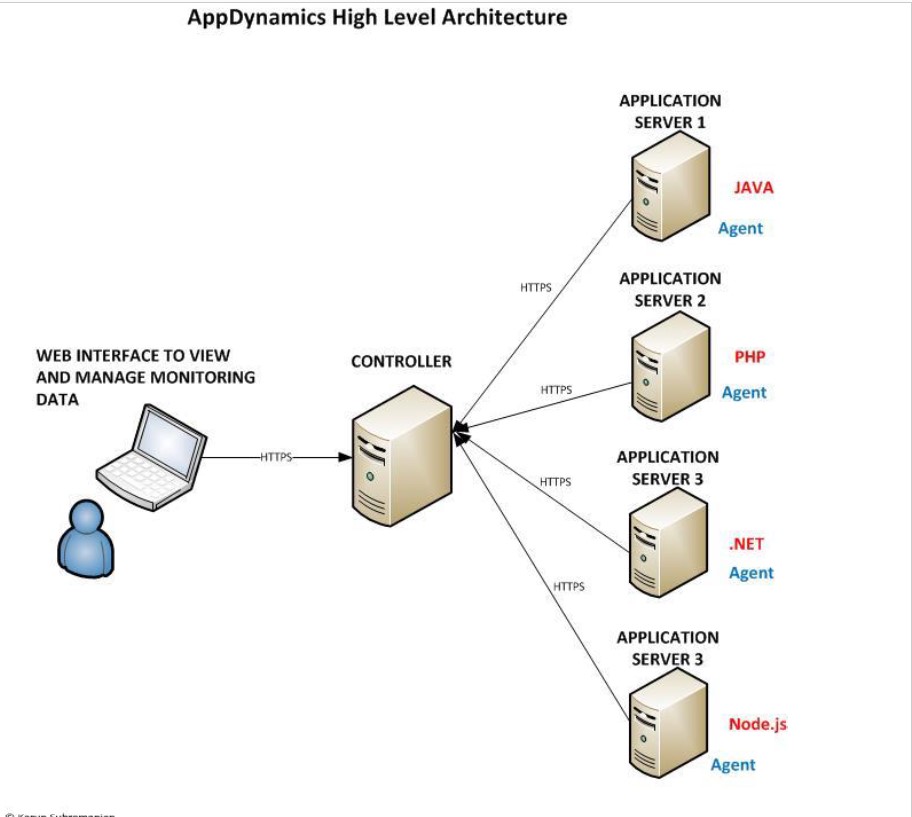
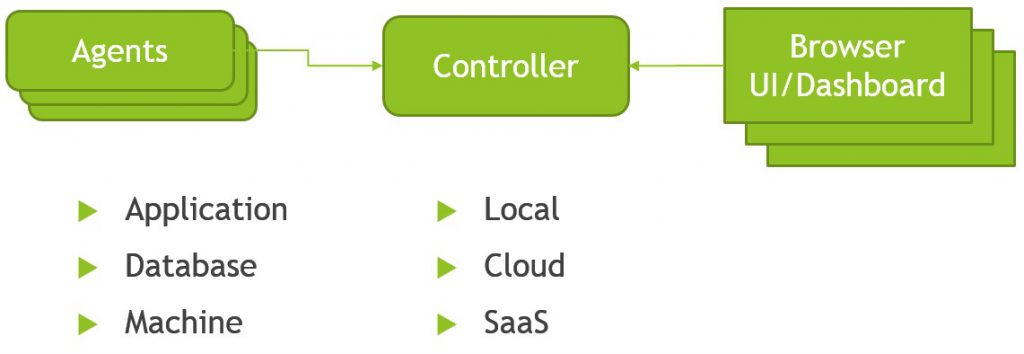
The controller is the engine of AppDynamics. It receives monitoring data from Agents installed on the Application servers (or Database Servers, Web Servers etc). The user accesses and manages the monitoring data by connecting to the Controller via web browser (usually at port 8090). It helps to understand the terminology used in AppDynamics to know how it works.
AppDynamics Terminology
Node
A node is a monitored Server or JVM (or CLR). Typically the node corresponds to an individual Application Server (Physical or Virtual)
Tier
A tier is a logical grouping of nodes generally relating to a particular business function. Note that an agent cannot belong to more than one Tier
Business Application
A Business Application is the top level container in AppDynamics. It contains Tiers. Role Based Access Controls in the Controller UI are implemented at the Business Application Level
Backends
Backends are any external systems to the AppDynamics agent that are not instrumented. For example, if a .NET Application that is instrumented makes a call to a SQL Server Database Server, if the SQL Server is not instrumented with AppDynamics agent, it is considered a ‘backend’ in the .NET application. The response time for the backend calls are recorded (along with load, errors etc). However, deeper level metrics are possible only when the remote system is instrumented. AppDynamics automatically recognizes most of the popular backend systems.
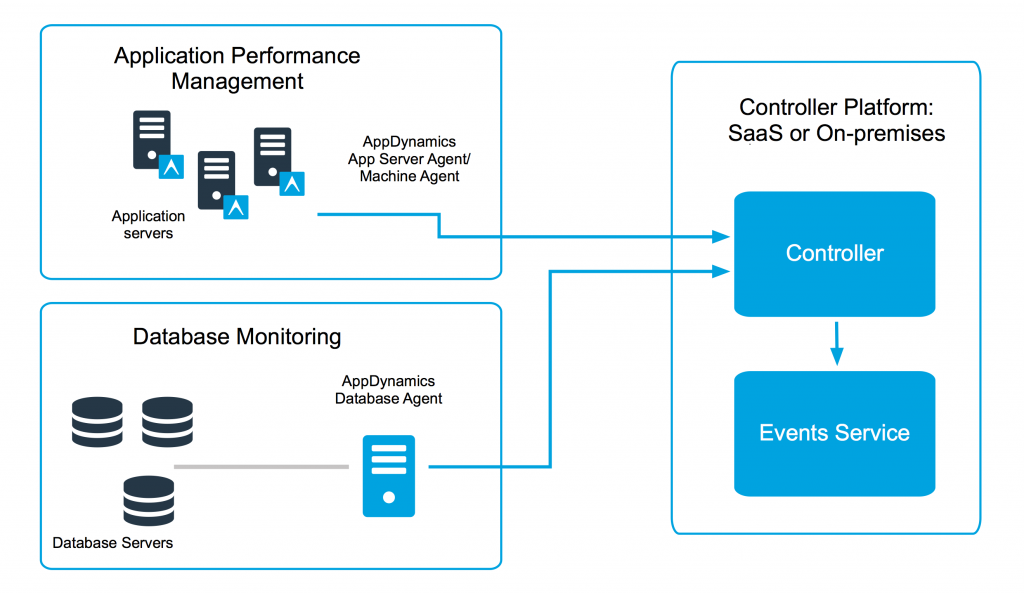
Types of AppDynamics Agents & Controllers
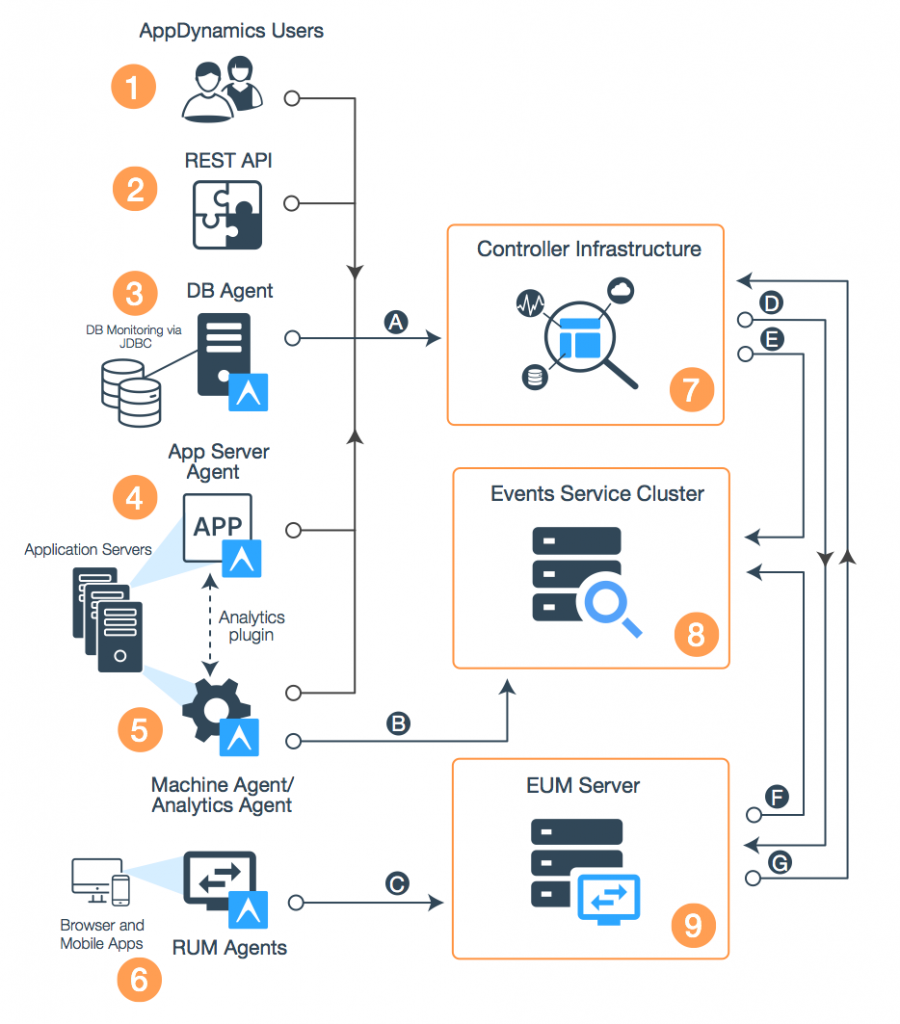
How AppDynamics Works?
AppDynamics Key Terms & Concepts
App agent
AppDynamics agents collect data about application, machine, and web page performance. Agents report data to the Controller.
Backend
AppDynamics gives you visibility into calls made to uninstrumented destinations inside or outside your application infrastructure. In AppDynamics, databases and remote services such as message queues are collectively known as backends.
Baseline
A baseline provides a known point of reference against whichperformance is measured. Dynamic baselines are based on observed performance over time. Static baselines are based on specific values. “
Business application
An AppDynamics business application models all components in an application environment that provide a complete set of functionality. AppDynamics correlates the components’ activities to provide performance data.”
Business metric
Business metrics capture data from a method’s parameters or return values to report on the performance of the business, such as revenue per transaction or number of orders. “
Business transaction
A business transaction represents a collection of user requests that accomplish a logical user activity, such as log in, check out,
etc., across a distributed business application. A single request is a business transaction instance.”
Controller
The Controller collects, stores, calculates baselines for, and analyzes performance data collected by AppDynamics agents. You can use On-Premise or SaaS controllers.”
Entry point
An entry point is a method or operation in the application code that begins or extends a business transaction.”
Flow map
A flow map graphically represents the tiers, nodes, and backends and the process flows between them. “
Health
Health in AppDynamics refers to the extent to which the application being monitored operates within the acceptable performance limits defined by health rules.
Health is indicated by a green/yellow/red color scheme.”
Health rule
Health rules allow you to select specific metrics as key to the overall health of an application and to define ranges for acceptable performance of those metrics. AppDynamics supplies default health rules that you can customize, and you can create new ones.”
Machine agent
A machine agent instruments a machine to report data about hardware and the network to a Controller. AppDynamics provides both a Standalone Machine Agent and an embedded
machine agent in the App Agent for .NET. The Standalone Machine Agent functionality can be extended to add more metrics. Many extensions are provided on the AppDynamics
eXchange.”
Node
A node is the basic unit of processing that AppDynamics monitors. An app agent or machine agent or both instrument a
node. Nodes belong to tiers.”
Service endpoint
Service endpoints provide a subset of the metrics for a tier, focused on a specific application service. You configure entry points for the app service and AppDynamics provides metrics and associated snapshots specific to the service.”
Tier
A tier represents a key service in an application environment, such as a website or processing application. A tier is composed of one or more nodes or backends. An “originating tier” is the tier that receives the first request of a business transaction. A “downstream tier” is a tier that is called from another tier.”
Transaction snapshot
A transaction snapshot is a set of diagnostic data for a business transaction instance across all app servers through which the business transaction has passed, at a specific point in time. Transaction snapshots help you troubleshoot the root causes of performance problems.
Flow maps
Provide intuitive views of live application traffic so that you can see where bottlenecks exist.”
Events
Lists various problems that have occurred during the time range specified for the dashboard, such as health rule violations, business transaction health, code problems, etc.”
Business transaction health
Displays the status of the business transactions, based on health rules defined for the application. “
Server health
Displays the status of the app servers (nodes) in the system, based on health rules defined for the application. “
Transaction scorecard
Displays the status of the business transactions, based on thresholds that specify when a transaction is slow, very slow, stalled, or in error status.”
Exceptions
Displays the number of code exceptions that have occurred.”
Service endpoints
Shows the number of times per minute each service endpoint was called.”
Load
Shows the number of calls per minute.”
Response time (ms)
Shows the average response time for all calls made.”
Errors
Shows the number of errors that have occurred.”
I’m a DevOps/SRE/DevSecOps/Cloud Expert passionate about sharing knowledge and experiences. I have worked at Cotocus. I share tech blog at DevOps School, travel stories at Holiday Landmark, stock market tips at Stocks Mantra, health and fitness guidance at My Medic Plus, product reviews at TrueReviewNow , and SEO strategies at Wizbrand.
Do you want to learn Quantum Computing?
Please find my social handles as below;
Rajesh Kumar Personal Website
Rajesh Kumar at YOUTUBE
Rajesh Kumar at INSTAGRAM
Rajesh Kumar at X
Rajesh Kumar at FACEBOOK
Rajesh Kumar at LINKEDIN
Rajesh Kumar at WIZBRAND
Find Trusted Cardiac Hospitals
Compare heart hospitals by city and services — all in one place.
Explore Hospitals
yes
Yes